Stone Wall Age Analysis for the Town of Little Comtpon, Rhode Island
Little Compton has the second highest density of stone walls (kilometer of wall per square kilometer of land area) in the state, bested only by New Shoreham (Block Island). One of the challenging aspects of studying historical land use patterns is often a lack of context that would otherwise hint at how old an element is. The nature of stone, impervious to weather and time, is a case in point.
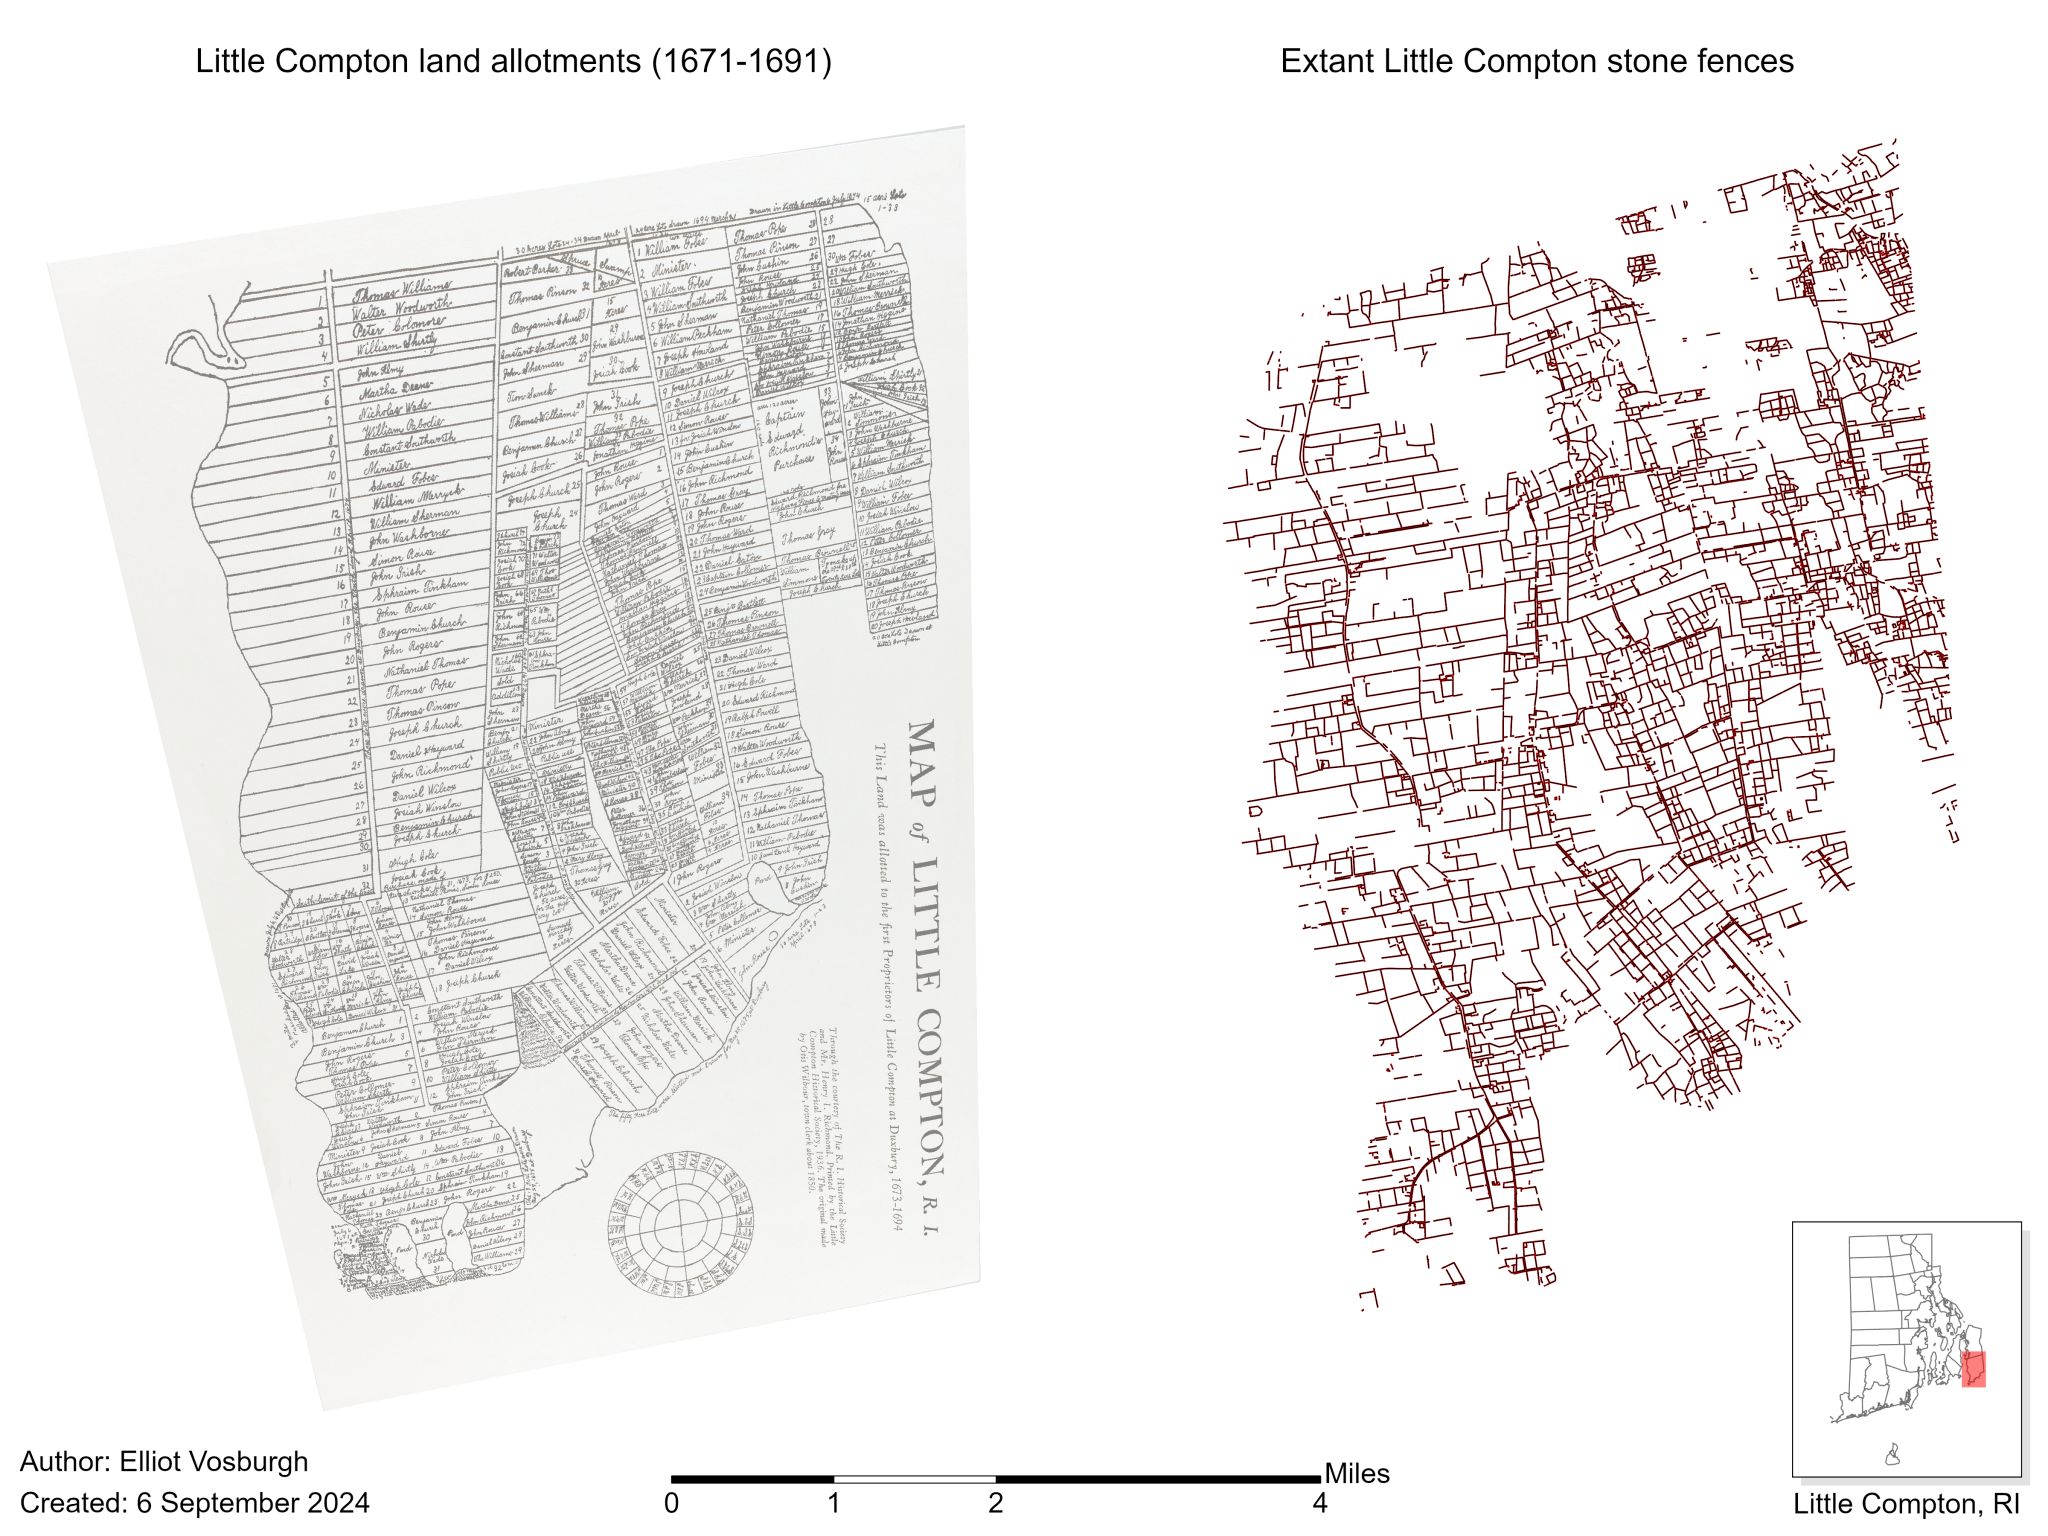
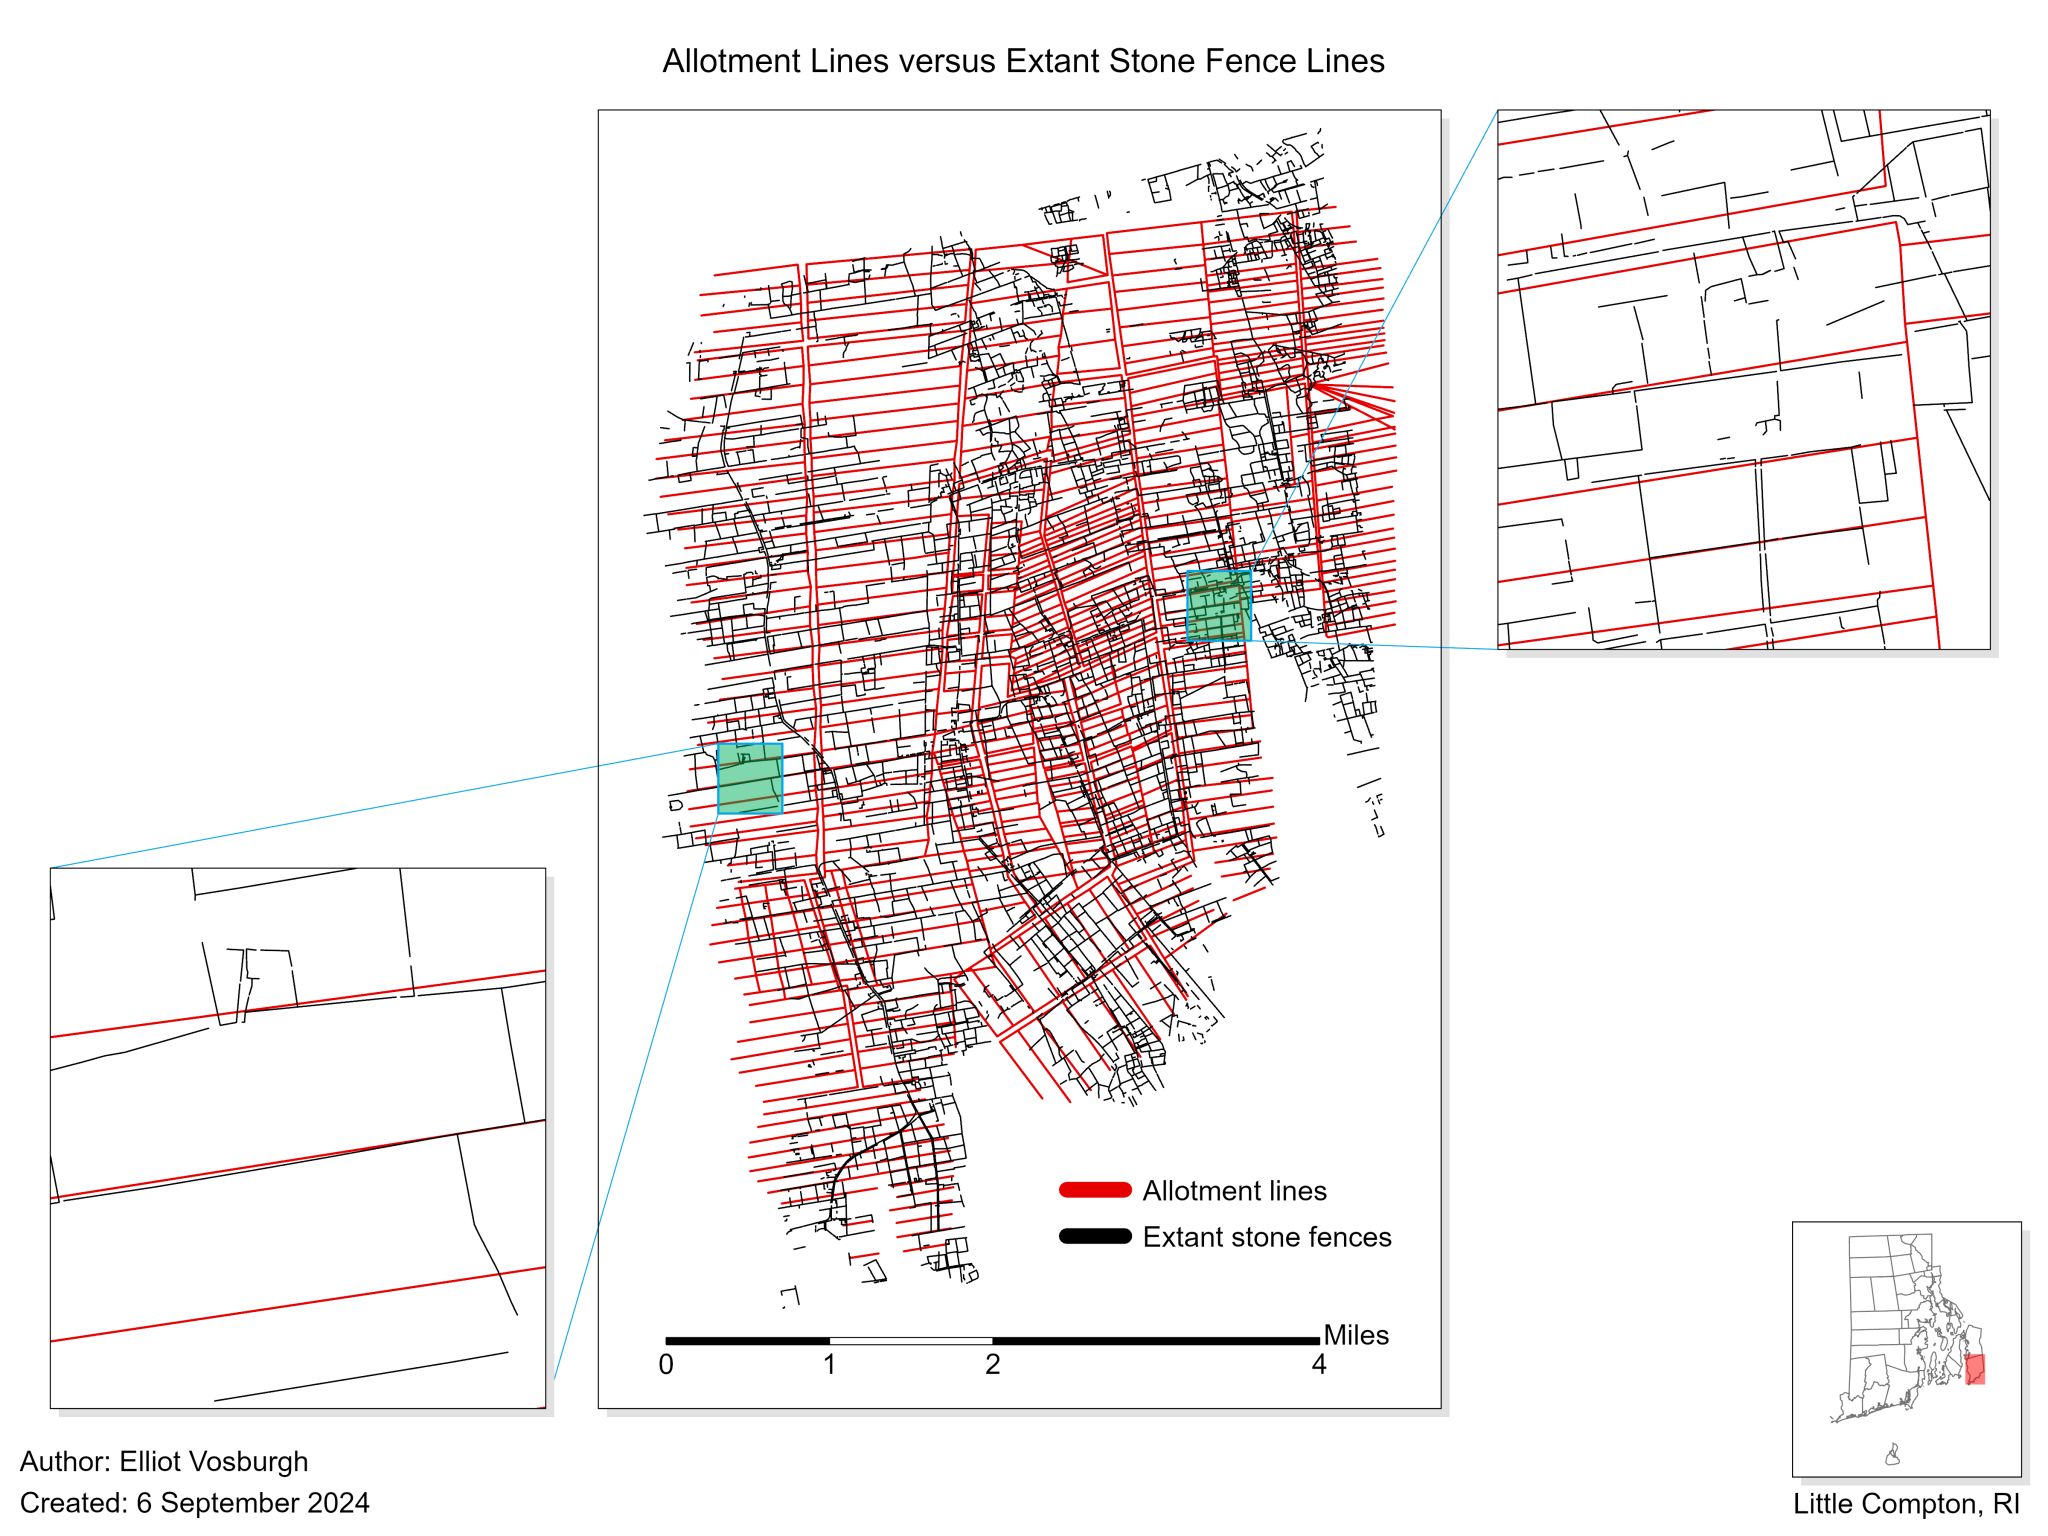
I was connected with the Little Compton Historical Society. After being shown a land allotment map from the 1600s (above, left), I knew I needed to compare the lines shown there with extant stone walls (above, right). The idea was to perform an analysis to compare allotment lines with extant wall lines (RISWMP) to see if anything matched up.
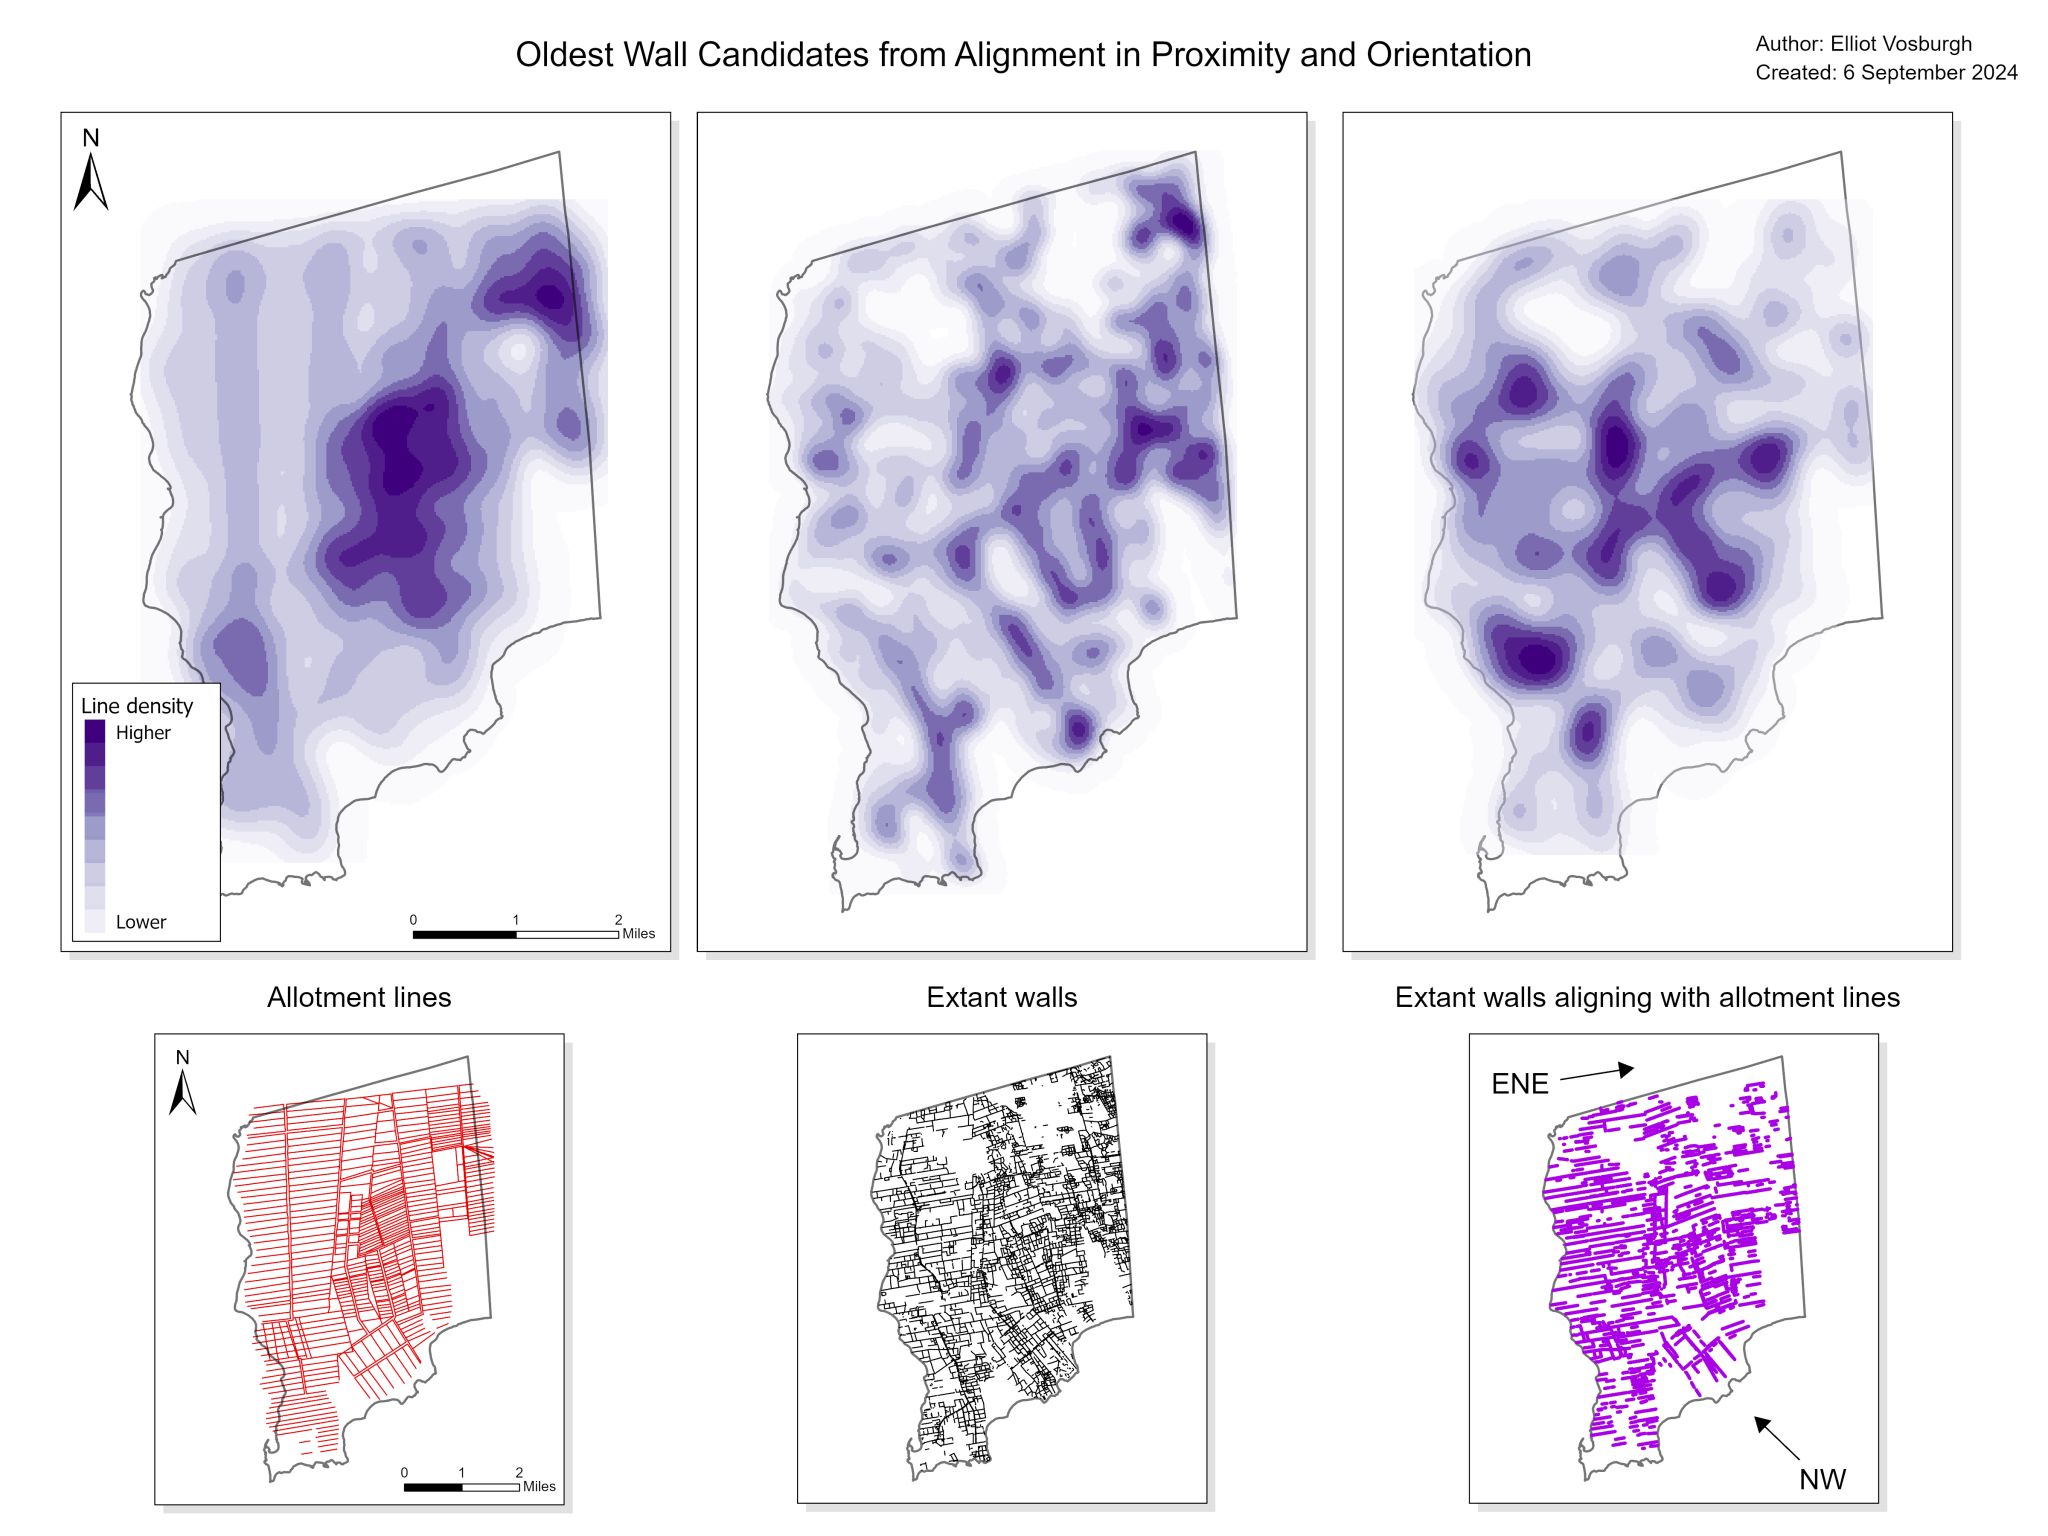
After accounting for errors in the allotment map, such as problems with georeferencing and how the original allotment map was drawn, it's clear that many extant walls align with these original boundaries.